Volatitliy Revisited
Volatility Revisited
September 26, 2022 by Lesjak Planning
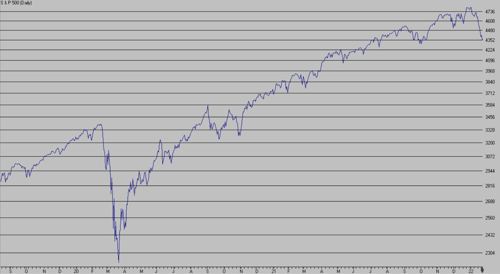
The current bout of price volatility in the financial markets reminds us of March 2020 during the onset of COVID where we saw the market averages decline 30-35% in a matter of weeks. Although the current environment is not nearly close to that experience percentage wise, it can still be quite unsettling during the short term. To put the recent action into perspective, the chart below encompasses both time periods and demonstrates how far we have come from the highs of February 2020 and one can argue we were a bit overextended on the upside and overdue for a pause.
How will all this play out? While the short term remains unclear, we believe that maintaining a diversified portfolio and a long term approach to investing will get us through these periods of volatility with the knowledge that the financial markets have historically rebounded from adverse periods only to make new highs eventually.
What is driving this current market activity?
So, what is driving this current market activity? Basically what has been in the headlines for months including supply chain issues which has driven up the cost of products which contributes to inflationary pressures, which leads the Fed to potentially increase interest rates, which in turn offers competition to stocks in the form of higher interest being paid on fixed income assets. And finally and most recently, the uncertainty over the Ukraine crisis. Financial markets hate uncertainty.


About the author
Lesjak Planning