2017 Mid-Year Update
2017 Mid-Year Update
June 28, 2017 by Lesjak Planning
As we reach the halfway point of 2017, we can summarize the year as being positive so far. In terms of the various markets, results have been on the positive side for most sectors. Except for the one day in May where the Dow Industrials dropped over 350 points, the equity markets have gradually climbed without any sustained declines. Large company stocks have gained about 9% year to date, Small company issues 2%, and Technology 16%. The commodity sector has experienced consistent declines as inflation continues to stay subdued and supplies plentiful. The grains remain cheap, precious metals remain well below their highs of last year, and oil has recently declined about 30% in the past month or so due to oversupply.
Corporate America has just come off one of the strongest earnings season in years. Manufacturing is increasing and major companies are investing once again in plants and machinery here at home. If tax reform becomes a reality we should see considerably more corporate assets come back to the States and be put to work.
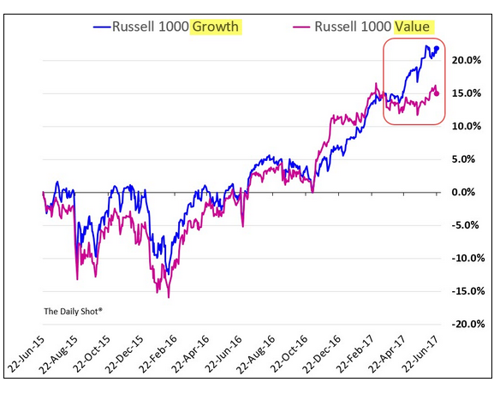
A diversified allocation also allows us to be invested as “reversion to the mean” occurs that we talked about in our December letter. The chart below shows the recent outperformance of growth stocks versus their value-style counterparts. Eventually, the value style will revert and catch up with growth. When and how quickly?
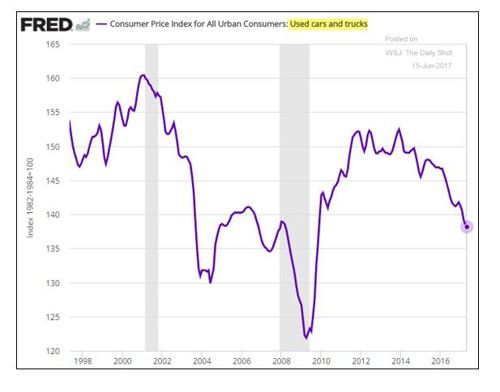
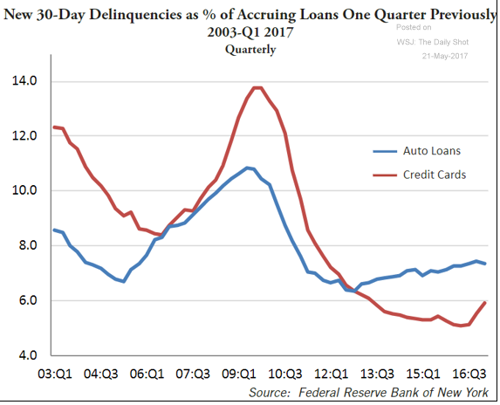
Is the red-hot auto market about to cool? Recent statistics show an increase in the amount of auto loan delinquencies, especially the sub-prime auto loans made to less credit worthy borrowers. As borrowers quit paying on long term loans, cars are repossessed and put on used car lots. Too many used cars in inventory cause their prices to decline substantially making them a better choice for buyers over new cars.
The subprime auto loans have grown to a daunting percentage and loan durations have gone out to 72 and 84 months. Those loans have an eerie similarity to the real estate subprime market and could potentially feed on itself in the same way if delinquencies accelerate.
On the operations front, we continue to stay ahead of the technology curve to provide our clients with up to date and secure accessibility to account information. Additionally, we continue to search out investment products and opportunities to keep up with a changing world.
For the past decade the theory of account aggregation has interested us. Early attempts at finding reliable, secure software to implement the process of gathering all of your financial records on one site proved fruitless. As time passes and we all become more dependent on quick, easy access to information, we pressed on in our search. We have successfully implemented a system which we will be rolling out individually that, if desired, can be used to track all of your financial assets at any institution with updates performed daily. So far, clients who have logged on and populated this site are providing positive feedback.
Our unending quest to uncover new investment ideas continues to take us around the country interviewing investment managers, attending seminars, and walking through farmland, oilfields, and vineyards. As the number of publicly traded companies in the U.S. decreases due to mergers and privatization, the stock and bond choices decrease accordingly. Less choices means less diversity, so we need to continue to find new options that will allow us to participate in future innovation while diversifying to help reduce overall risk.
Innovations and products that will provide potential for exceptional investment returns are coming to us at a rapid pace. Technology in areas such as self-driving autos and trucks, 3D printers turning out everything from household products to replacement bones and organs for humans, and ongoing privatized space travel are just a few areas.
As investors and advisors we cannot become complacent in our strategies and research. We will continue to expand both our knowledge and our tools to research and adapt newfound ideas to diversify portfolios and position assets for growth in the future.
Enjoy the summer months! Like everything else, it seems to go by quickly.
Sincerely,
The Lesjak Planning Team
Dave, Mike, Marc, Nathan, Kevin, Kathy, and Jessica
The headwinds of the drama in the political world, more terrorist attacks, North Korea, rate increases by the Federal Reserve, and softer economic numbers have not damaged the equity markets upward momentum.
It seems as though markets, such as the tech sector recently, correct by sector versus the overall selling stampedes in the past. Recently analysts have estimated there is substantial buying power still on the sidelines to the tune of roughly seven trillion dollars.
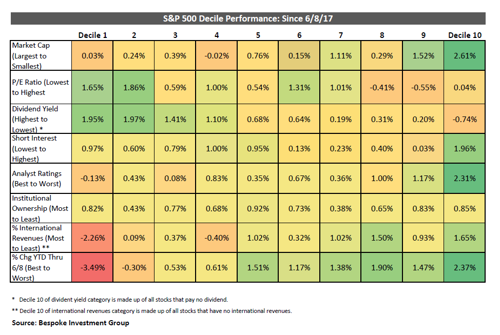
The benefits of asset allocation continue to be verified as money in the markets rotate from sector to sector with no prior warning. The chart below shows a matrix that illustrates how smaller stocks have been outperforming the largest stocks, the stocks with the highest dividend yields have outperformed stocks with no dividends, the stocks most unloved by analysts have been outperforming, and stocks with heavy international revenue exposure have gotten hit. This is a complete reversal of what was working in 2017 prior to just a few weeks ago. By diversifying assets across these sectors, we are positioned to gain by this rotation.


About the author
Lesjak Planning